Change Language :
iglidur® T220 - material data
The most important specifications at a glance
iglidur T220 is a special material for applications in the tobacco processing industry. It fulfils the demands of the tobacco industry (engineering database). The material is free of undesirable or banned ingredients, as requested by reputed manufacturers from 2004 onward.
| Descriptive technical specifications | ||
|---|---|---|
| Wear resistance at +23°C | - 🟧 🟧 ⬜️ ⬜️ ⬜️ + | More information on wear resistance |
| Wear resistance at +90°C | - 🟧 ⬜️ ⬜️ ⬜️ ⬜️ + | |
| Wear resistance at +150°C | - 🟧 ⬜️ ⬜️ ⬜️ ⬜️ + | |
| Slide property | - 🟧 🟧 ⬜️ ⬜️ ⬜️ + | Coefficient of friction, dynamic, against steel: µ 0.20 - 0.32 |
| Wear resistance under water | - 🟧 🟧 ⬜️ ⬜️ ⬜️ + | |
| Media resistance | - 🟧 🟧 🟧 ⬜️ ⬜️ + | More information on media resistance |
| Resistant to edge pressures | - 🟧 🟧 🟧 ⬜️ ⬜️ + | |
| Resistant to shock and impact loads | - 🟧 🟧 🟧 ⬜️ ⬜️ + | |
| Dirt resistance | - 🟧 🟧 🟧 🟧 ⬜️ + |
Temperatures
The flexibility of the bearings depends on the temperature. Even +60°C leads to a significant increase in flexibility. An additional safety device is required for temperatures above +50°C.
Temperatures, thermal expansion coefficient
| min. application temperature | Upper application temperature, long-term | Upper application temperature, short-term | In addition secure axially from |
|---|---|---|---|
| -40°C | +100°C | +160°C | +50°C |
Permissible surface speeds
The maximum surface speed of iglidur T220 plain bearings is 0.4m/s when rotating continuously. The friction and the associated heating limit the permissible speeds. This means that higher speeds can be used in intermittent or linear operation.
Surface speed of various iglidur materials
| Maximum surface speeds [m/s] | Rotating | Oscillating | linear |
|---|---|---|---|
| Long-term | 0.4 | 0.3 | 1.0 |
| Short-term | 1.0 | 0.7 | 2.0 |
Permissible pv values
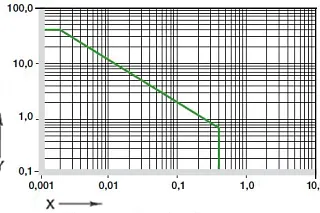
Diagram 01: Permissible pv values for iglidur T220 plain bearing with 1mm wall thickness in dry operation against a steel shaft, at +20°C, installed in a steel housing
X = surface speed [m/s]
Y = pressure [MPa]
Mechanical specifications
The maximum recommended surface pressure is a mechanical material parameter. Conclusions about the tribology cannot be drawn from this. The compressive strength of iglidur T220 plain bearings decreases with increasing temperatures. Diagram 02 illustrates this relationship. iglidur T220 plain bearings can be loaded up to the permissible limit of 45MPa. The deformation is then almost 2%. The permissible load is further limited by higher temperatures (diagram 02).


Friction and wear
By complying with the specifications of the tobacco processing industry, the friction and wear values of the iglidur T220 plain bearings clearly lag behind those of the best iglidur plain bearing. The coefficient of friction decreases with the load while it only increases slightly at higher speeds.
Coefficients of friction against steel (Ra = 1μm, 50 HRC):
| iglidur T220 | dry | Greases | Oil | Water |
|---|---|---|---|---|
| Coefficient of friction μ | 0.20 - 0.32 | 0.09 | 0.04 | 0.04 |


Shaft materials
Diagram 06 shows test results with different shaft materials, which were carried out with plain bearings made of iglidur T220. Diagram 07 shows that the bearings react with a strong increase in wear when the load is increased. Care should therefore be taken to keep the load below 5MPa by dimensioning the bearings sufficiently.


Chemical resistance
iglidur T220 plain bearings are resistant to highly diluted alkalis and very weak acids.
All data at room temperature [+20 °C], + resistant 0 conditionally resistant - non-resistant
| Medium | Resistance |
|---|---|
| Alcohols | + |
| Greases, oils without additives | + |
| Hydrocarbons | - |
| Fuels | + |
| Strong alkalines | - |
| Strong acids | - |
| Diluted alkalines | - |
| Diluted acids | 0 |
Moisture absorption

Installation tolerances
iglidur T220 plain bearings are standard bearings for shafts with h-tolerance (recommended minimum h9). The bearings are designed for press-fit into a housing machined to a H7 tolerance. After installation in a housing with nominal dimensions, the inner diameter of the bearings with E10 tolerance adjusts automatically. For certain dimensions, the tolerance deviates from this depending on the wall thickness (see product range).
Important tolerances according to ISO 3547-1 after press-fit:
| Diameter d1 [mm] | Housing H7 [mm] | iglidur Q290 plain bearing E10 [mm] | Shaft h9 [mm] |
|---|---|---|---|
| up to 3 | +0.000 +0.010 | +0.014 +0.054 | -0.025 +0.000 |
| > 3 up to 6 | +0.000 +0.012 | +0.020 +0.068 | -0.030 +0.000 |
| > 6 up to 10 | +0.000 +0.015 | +0.025 +0.083 | -0.036 +0.000 |
| > 10 up to 18 | +0.000 +0.018 | +0.032 +0.102 | -0.043 +0.000 |
| > 18 up to 30 | +0.000 +0.021 | +0.040 +0.124 | -0.052 +0.000 |
| > 30 up to 50 | +0.000 +0.025 | +0.050 +0.150 | -0.062 +0.000 |
| >50 to 80 | +0.000 +0.030 | +0.060 +0.180 | -0.074 +0.000 |
| >80 to 120 | +0.000 +0.035 | +0.072 +0.212 | -0.087 +0.000 |
| > 120 up to 180 | +0.000 +0.040 | +0.085 +0.245 | -0.100 +0.000 |
✓ 38 plastic bearings made from the most important iglidur materials
✓ Templates for finding the perfect material for your application
✓ iglidur bearing technology catalogue

Buy iglidur T220 products in the online shop
- Large selection of moulds and materials
- Available within 24 hours
- No minimum order value
- No minimum order quantity

Consulting
I look forward to answering your questions
Hennlich, d.o.o.+386 4 532 06 15Write e-mail
Shipping and consultation
In person:
Monday to Friday from 7 am - 8 pm.
Saturdays from 8 am- 12 pm.
Online:
24h
WhatsApp-Service:
Montag – Freitag: 8 – 16 Uhr